Multithreaded rust on Threadripper
I recently ran some benchmarks on a Threadripper 3960X system and the results were surprising me quite a bit. Simplified, the throughput the benchmark recorded went down, from 341 MB/s on a MBP to 136 MB/s on a Threadripper desktop. Prior I had read Daniel Lemire's notes on the sub optimal performance for simdjson on Zen 2, which is heavily used in the benchmark, but the suggested drop were a few percent not half.
Long story short, this made me curious what caused this. First stop: perf.
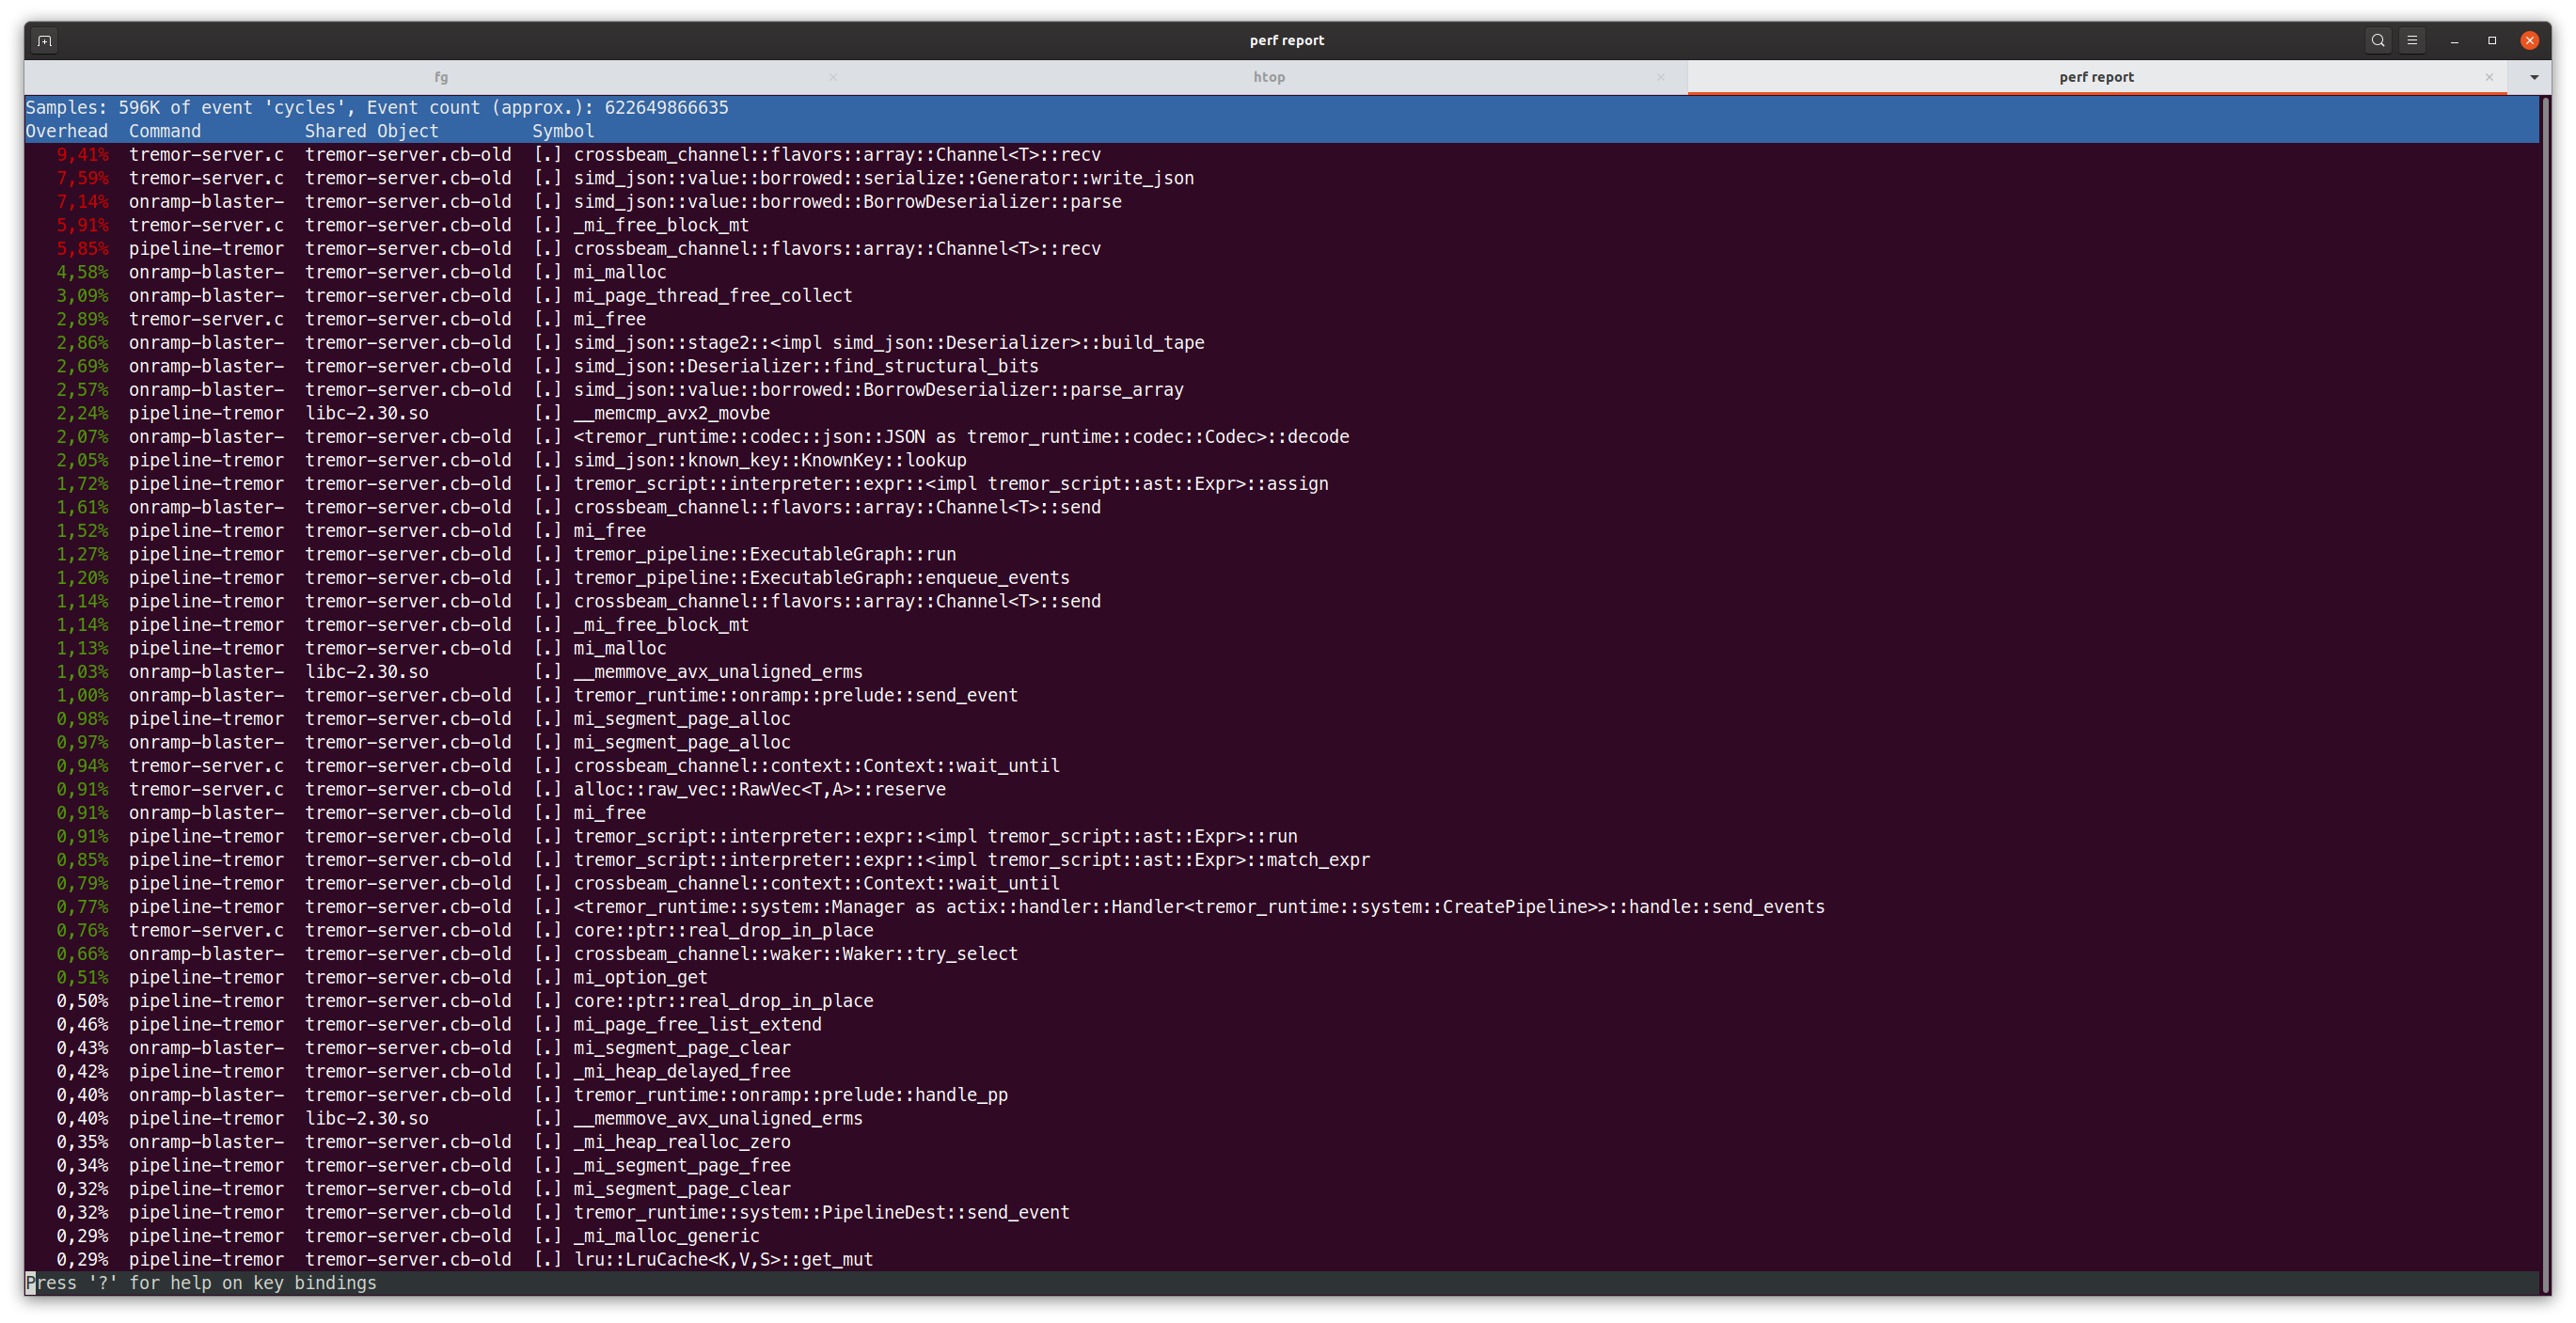
Notice the first item? It is crossbeam_channel::flavors::array::Channel<T>::recv. Oh my, I never saw that one hogging so much cpu time, in fact we spend more time in receiving from the channel then we spend in parsing or serializing JSON!
Lets add a bit of Threadripper trivia, the design AMD went with was splitting the CPU from a single silicon to multiple small dies, they call CCDs with in turn are consists of two CCXs that then contain the cores and level 1-3 cache. So lets look at another thing, htop (trusty little tool to show our load):
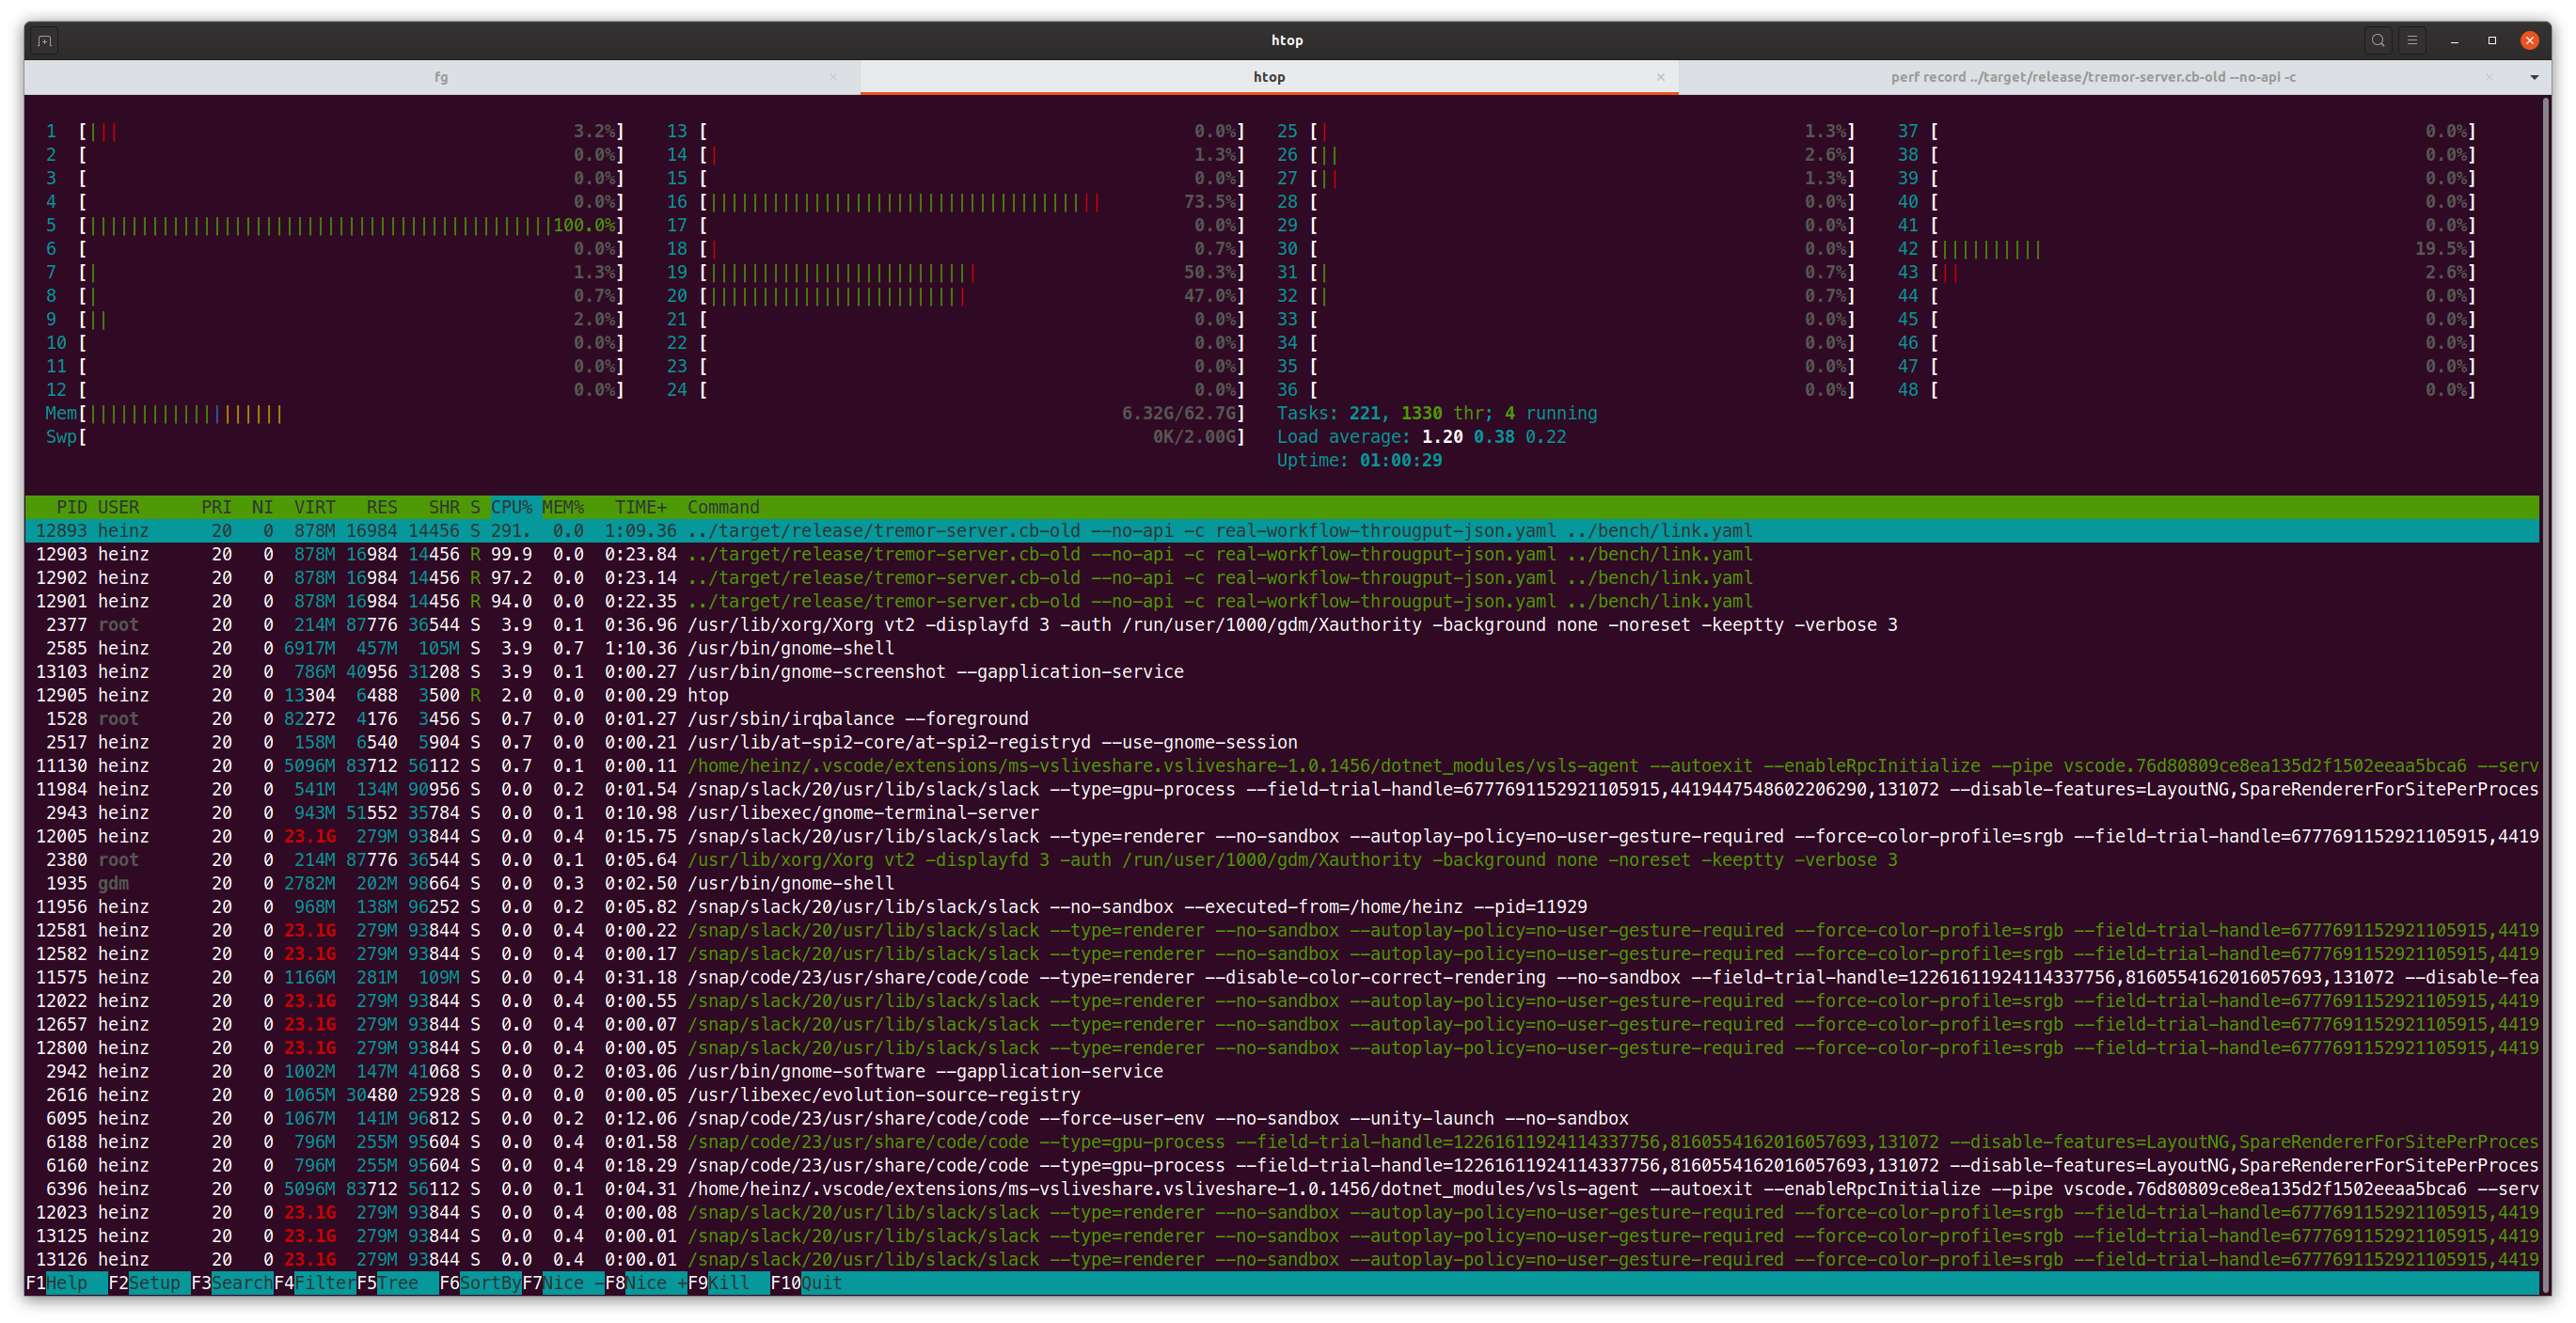
In this screenshot we can spot that one thread seems to be running on the 5th core, one on the 16th and one on the 19th and 20th. Thinking back to the design of the Threadripper this is a bit of a hint, those cores are on different CCXs and even further on different CCDs so what happens if they were on the same?
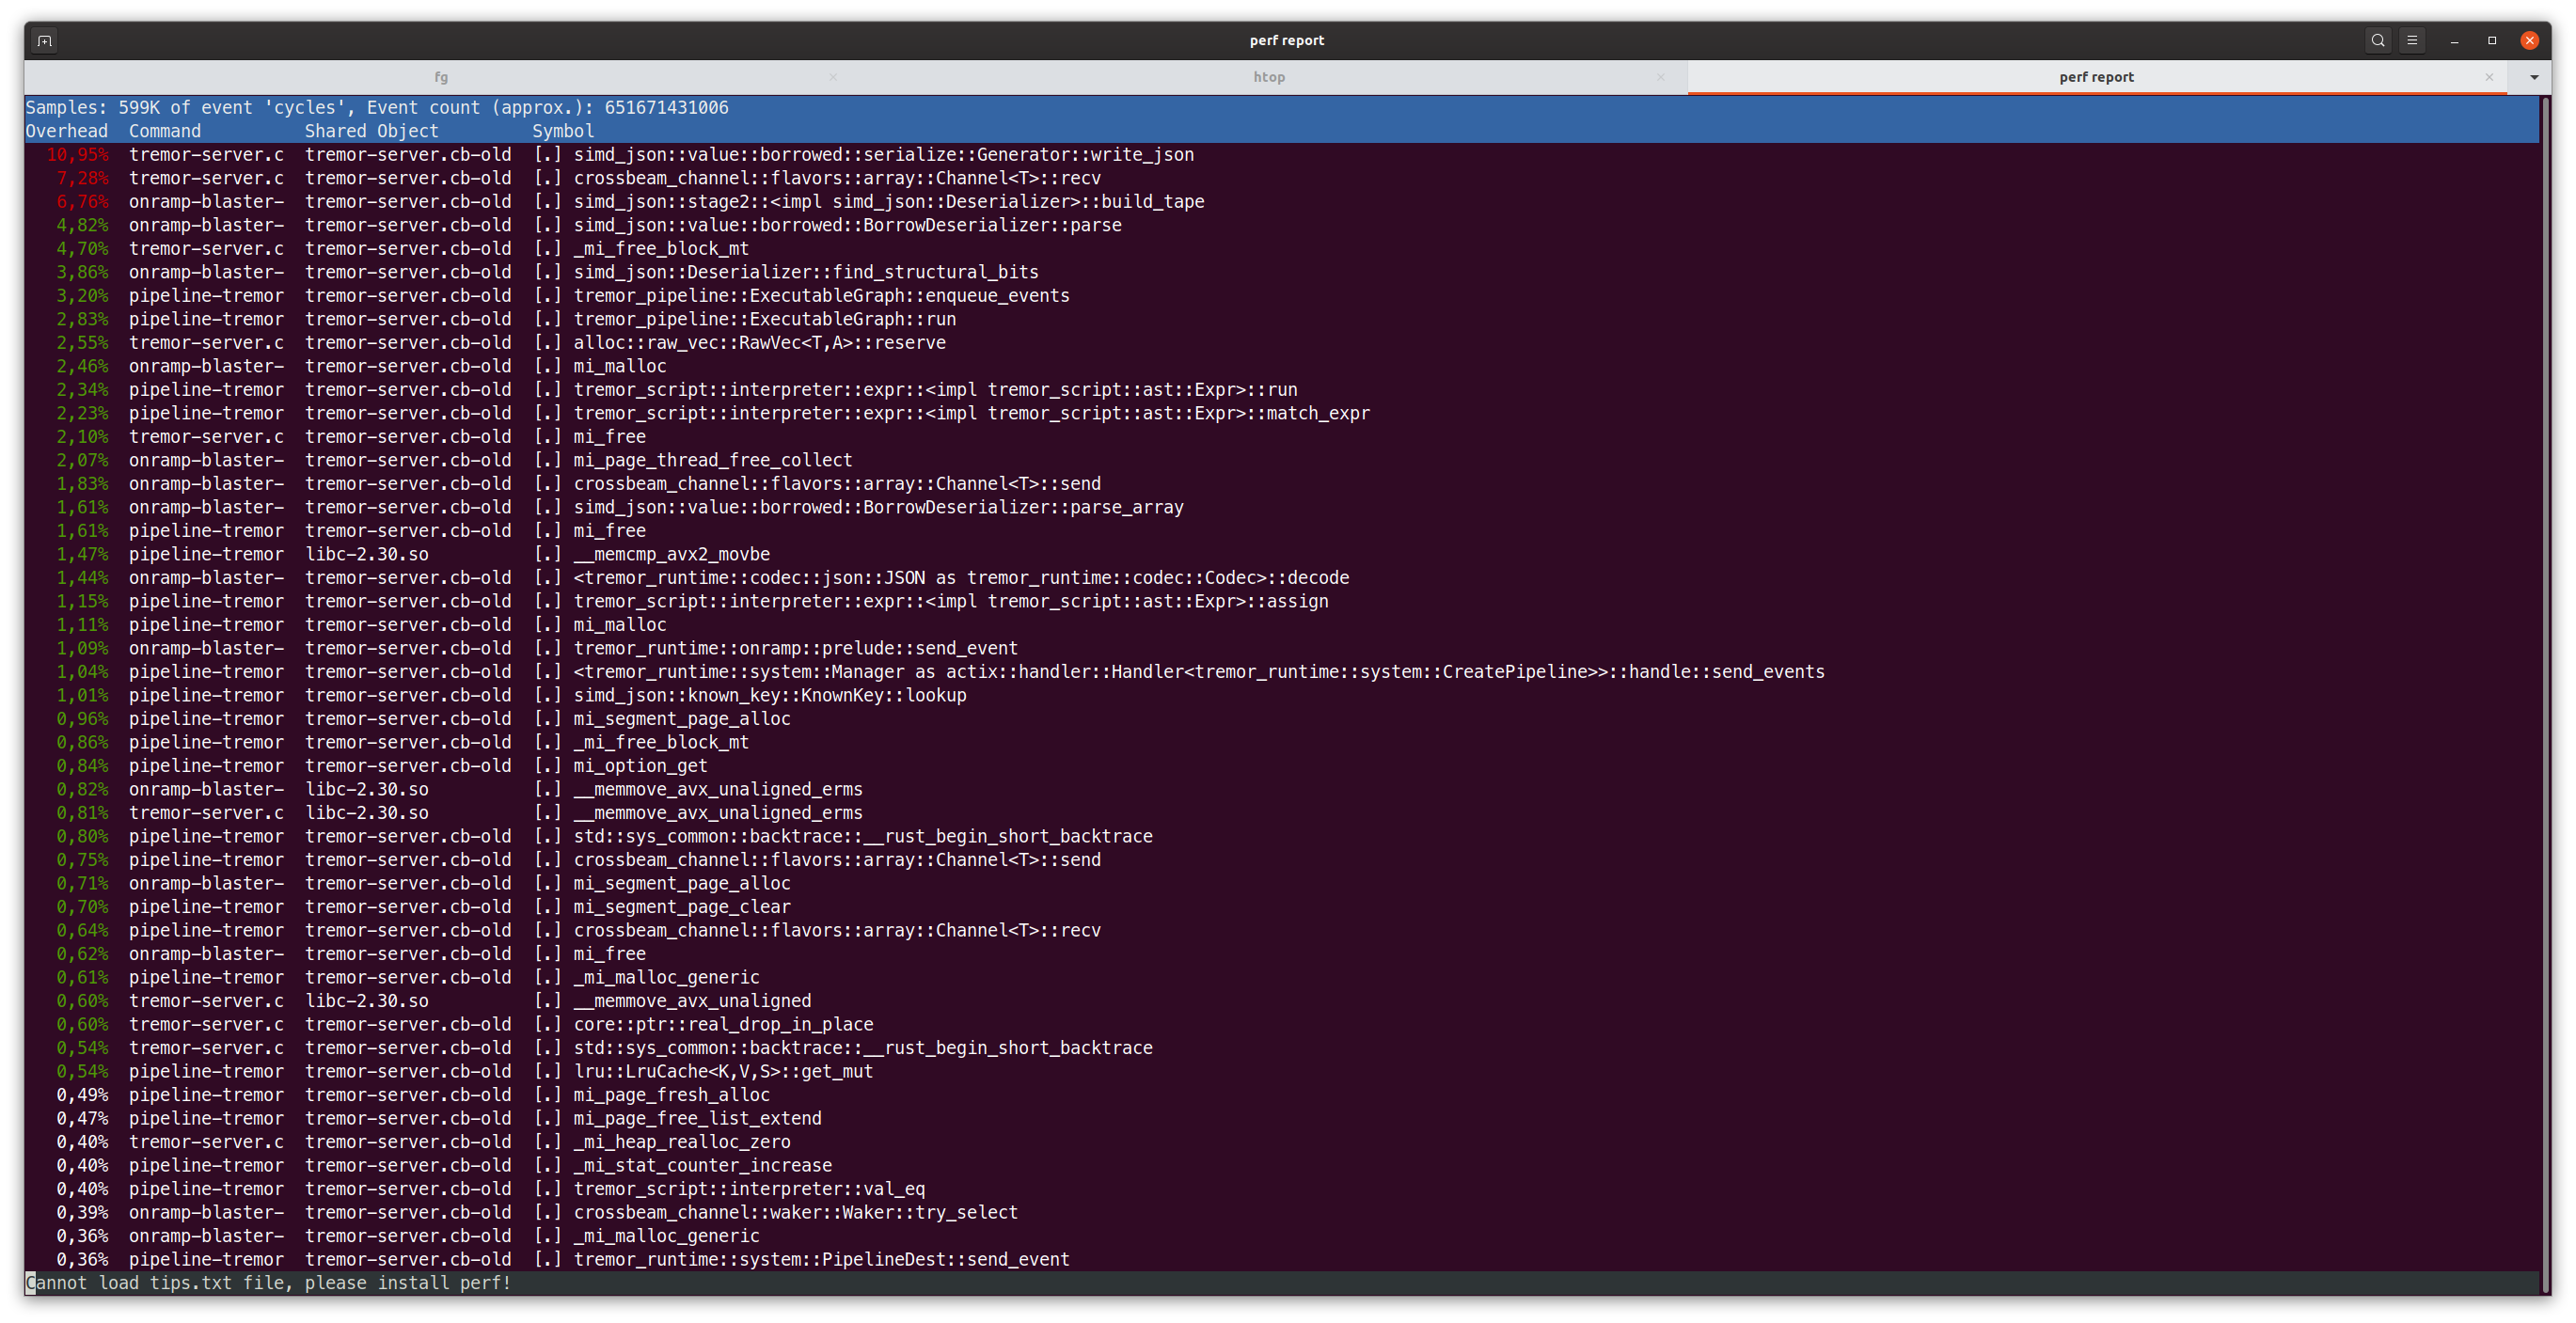
Boom 400+ MB/s! taskset -c 0,1,2 does the trick, that's a really nice improvement and looking at the perf output we can see recv to move from nearly 11% of CPU time to 7.28%, now that's a neat improvement. Not only is it nearly 3x faster then the first benchmark but also is it 20% faster then on the laptop. So far so good.
But it's still leaves the question, why and if we can do something about this. Enter a little benchmark and look at what it puts out for the first core (it's a lot of output otherwise).
B 0 -  0: -
B 0 -  1: 818us/send
B 0 -  2: 673us/send
B 0 -  3: 2839us/send
B 0 -  4: 2421us/send
B 0 -  5: 2816us/send
B 0 -  6: 3466us/send
B 0 -  7: 3634us/send
B 0 -  8: 3267us/send
B 0 -  9: 3042us/send
B 0 - 10: 3633us/send
B 0 - 11: 3535us/send
B 0 - 12: 3334us/send
B 0 - 13: 3443us/send
B 0 - 14: 3348us/send
B 0 - 15: 3398us/send
B 0 - 16: 3459us/send
B 0 - 17: 3108us/send
B 0 - 18: 3287us/send
B 0 - 19: 3393us/send
B 0 - 20: 3369us/send
B 0 - 21: 3248us/send
B 0 - 22: 3290us/send
B 0 - 23: 3323us/send

B 0 - 24: 487us/send
B 0 - 25: 812us/send
B 0 - 26: 676us/send
B 0 - 27: 2859us/send
B 0 - 28: 2853us/send
B 0 - 29: 2864us/send
B 0 - 30: 3475us/send
B 0 - 31: 3620us/send
B 0 - 32: 3582us/send
B 0 - 33: 3497us/send
B 0 - 34: 3524us/send
B 0 - 35: 3488us/send
B 0 - 36: 3331us/send
B 0 - 37: 3303us/send
B 0 - 38: 3365us/send
B 0 - 39: 3333us/send
B 0 - 40: 3324us/send
B 0 - 41: 3363us/send
B 0 - 42: 3554us/send
B 0 - 43: 3351us/send
B 0 - 44: 3207us/send
B 0 - 45: 3240us/send
B 0 - 46: 3377us/send
B 0 - 47: 3275us/send
First things first, the numbers here are 0 indexed, unlike in htop where they're 1 indexed. So core 0 here means core 1 in htop. The test runs only for a second per core combination (as it goes through all cores and otherwise takes a really long time), some variation is to be expected. That gets really slow really fast. We can see that core 24-47 are the SMTs cores on the physical cores 0-23, so 24 being the second thread on core 0. The second observation is that core 0-2 are in the same CCX, performance is reasonable fast here. 3-5 seem to be on the same CCD and so on.
Lets look at the code for the crossbeam channel. The part that's interesting is that both head and tail are wrapped in CachePadded. Fortunately I have a friend who keeps going on about false sharing whenever performance becomes a topic so that was a really good hint here. Looking through the struct aligning head and tail to the cache line makes a lot of sense they're frequently accessed from both sides of the queue but there is another part that's frequently used on both sides. The buffer, and that is just an array of T so it might not align well to the cache. In other words, if we access buffer[x] we might invalidate buffer[x-1] or buffer[x+1] (or more). So what happens if we wrap the the elements in a CachePadded?. The result looks quite nice, it cut down by 50% when going over CCX boundaries:
B 0 -  0: -
B 0 -  1: 630us/send
B 0 -  2: 678us/send
B 0 -  3: 1319us/send
B 0 -  4: 1256us/send
B 0 -  5: 1291us/send
B 0 -  6: 1438us/send
B 0 -  7: 1504us/send
B 0 -  8: 1525us/send
B 0 -  9: 1660us/send
B 0 - 10: 1772us/send
B 0 - 11: 1807us/send
B 0 - 12: 1382us/send
B 0 - 13: 1380us/send
B 0 - 14: 1387us/send
B 0 - 15: 1375us/send
B 0 - 16: 1382us/send
B 0 - 17: 1383us/send
B 0 - 18: 1471us/send
B 0 - 19: 1471us/send
B 0 - 20: 1463us/send
B 0 - 21: 1462us/send
B 0 - 22: 1468us/send
B 0 - 23: 1457us/send

B 0 - 24: 466us/send
B 0 - 25: 619us/send
B 0 - 26: 671us/send
B 0 - 27: 1438us/send
B 0 - 28: 1422us/send
B 0 - 29: 1514us/send
B 0 - 30: 1789us/send
B 0 - 31: 1688us/send
B 0 - 32: 1812us/send
B 0 - 33: 1820us/send
B 0 - 34: 1719us/send
B 0 - 35: 1797us/send
B 0 - 36: 1383us/send
B 0 - 37: 1364us/send
B 0 - 38: 1373us/send
B 0 - 39: 1383us/send
B 0 - 40: 1370us/send
B 0 - 41: 1390us/send
B 0 - 42: 1468us/send
B 0 - 43: 1467us/send
B 0 - 44: 1464us/send
B 0 - 45: 1463us/send
B 0 - 46: 1475us/send
B 0 - 47: 1467us/send
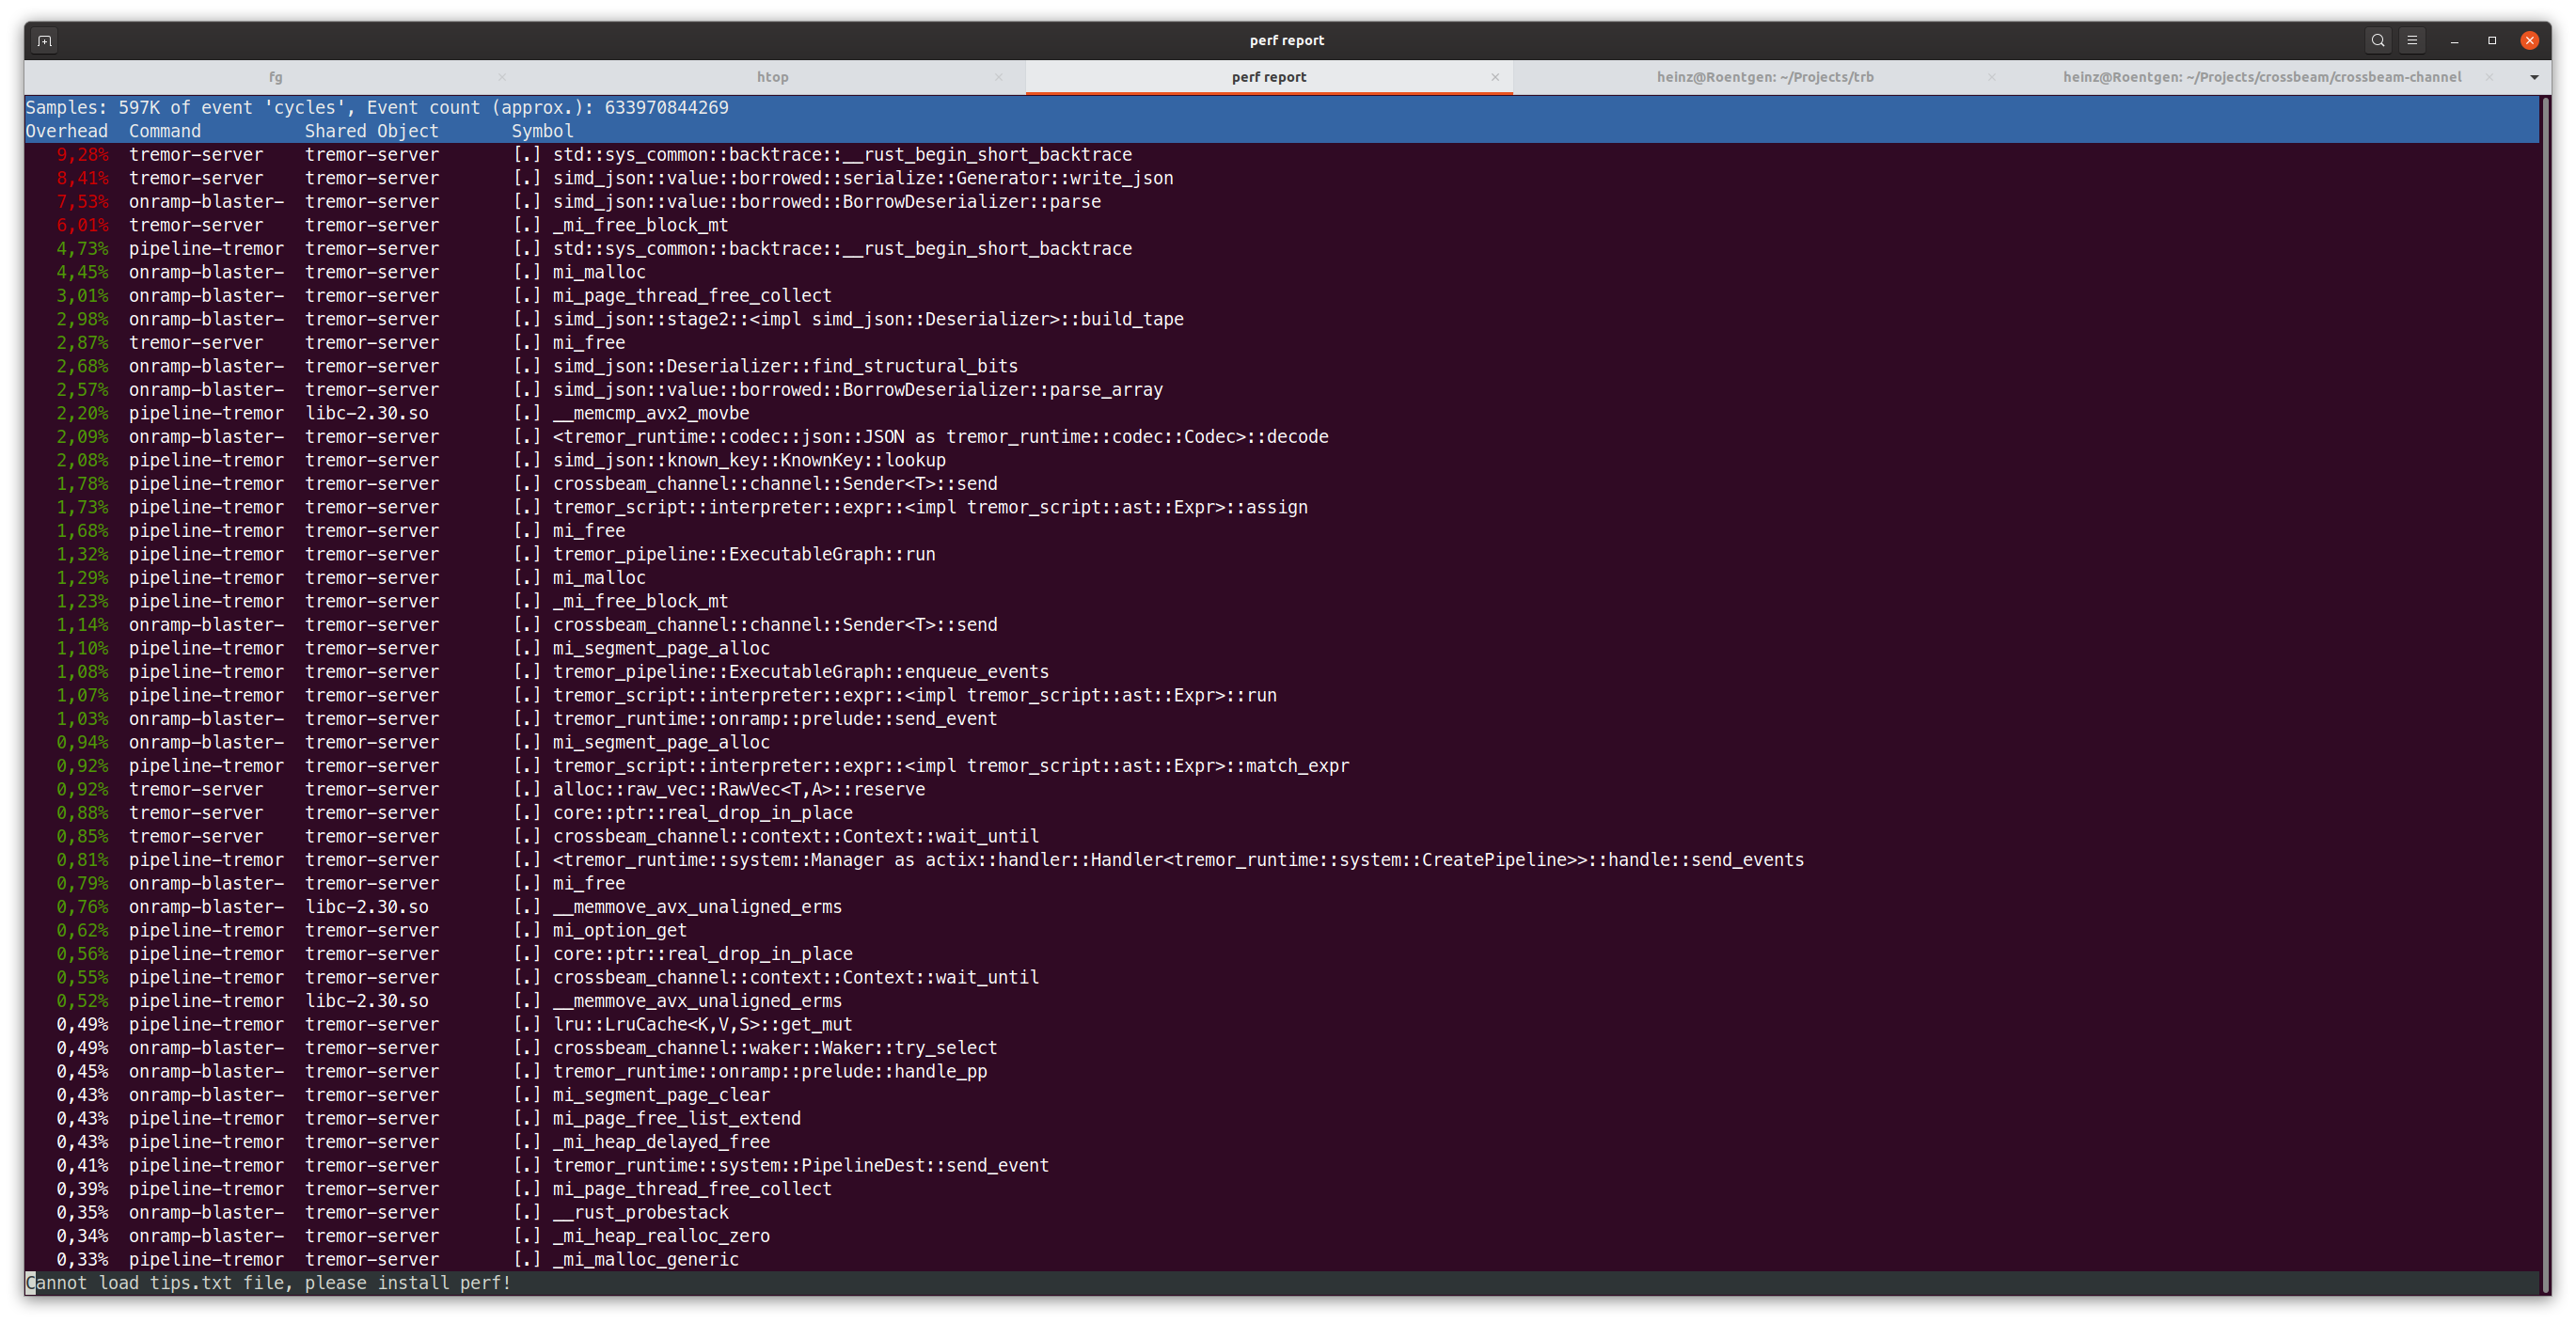
With all of this, the code went from 136 MB/s to over 150 MB/s when not pinned to cores, while this isn't close to where I'd like to to be, it is a 10% improvement in throughput. And looking at perf again recv is completely gone from the list, which is nice!
This is the conclusion for now, if I have more interesting finds I'll add a continuation - so I'll keep digging.