Erlang and more DTrace
Some nice additions to the little Erlang DTrace demo. For once I've added a filed to input custom scripts which are run on the server which is pretty neat since it allows running all kind of (l)quantize based scripts from the server and get a nice heatmap.
Like how about the heatmap of how Erlang function call times?
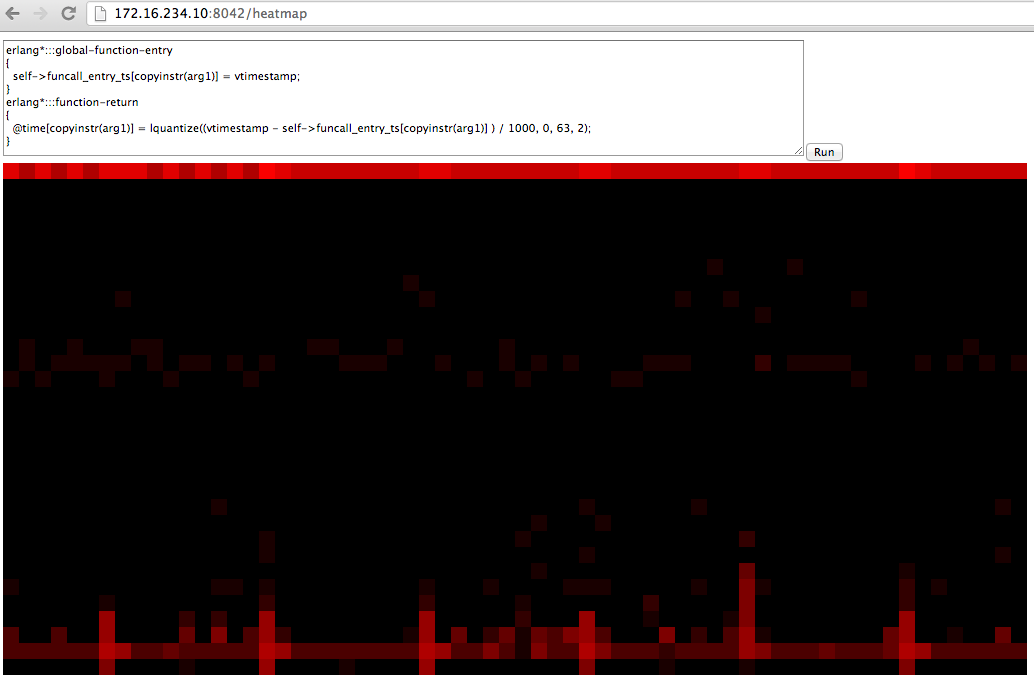
The script used (also included in the repository):
erlang*:::global-function-entry
{
  self->funcall_entry_ts[copyinstr(arg1)] = vtimestamp;
}
erlang*:::function-return
{
  @time[copyinstr(arg1)] = lquantize((vtimestamp - self->funcall_entry_ts[copyinstr(arg1)] ) / 1000, 0, 63, 2);
}
Now that is already cool but there is more, in addition to there is a page now that allows to show list based queries (as count or sum) so for example it would be very easy to get a profiling of an Erlang program like this:
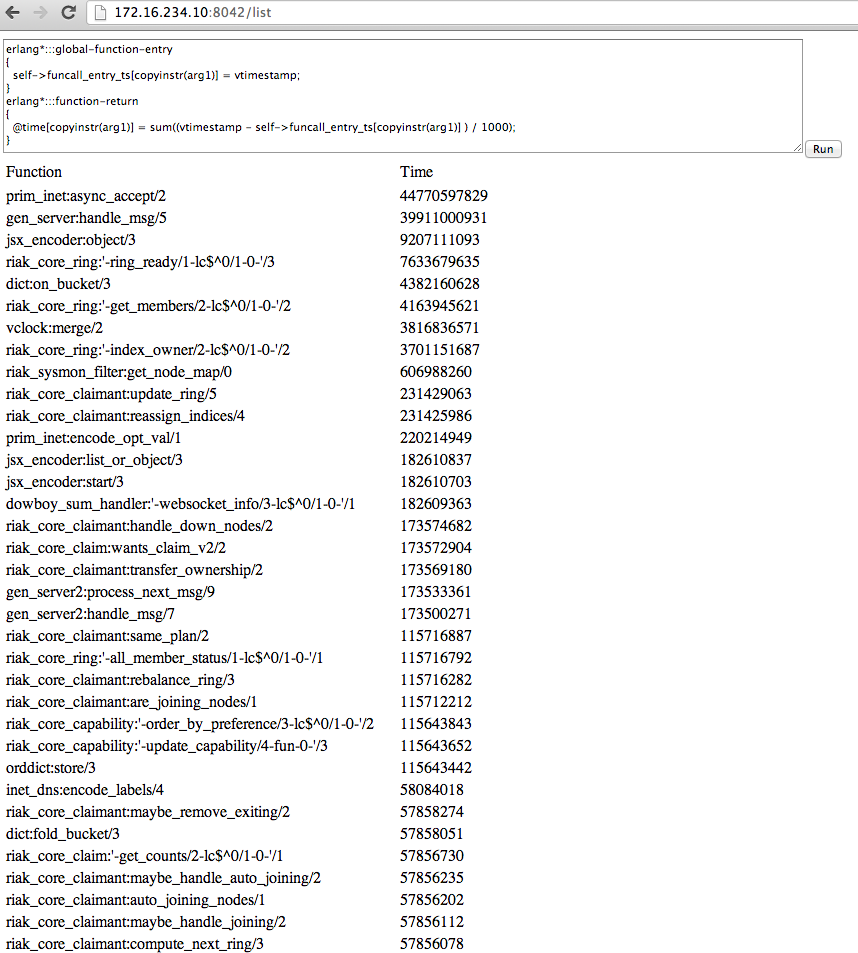
The script used (also included in the repository):
erlang*:::global-function-entry
{
  self->funcall_entry_ts[copyinstr(arg1)] = vtimestamp;
}
erlang*:::function-return
{
  @time[copyinstr(arg1)] = sum((vtimestamp - self->funcall_entry_ts[copyinstr(arg1)] ) / 1000);
}
Cool thing is this profiling can be turned on and off in a live system and has a comparable low performance impact (less then 50% unless functions are hammering in my tests).
To add to the joy, the scripts are stopped the moment the page is closed eliminating every kind of overhead, without restarting anything!
So lets sum this up, the old news (when you played with dtrace before) is that you can profile and analyse your applications on the fly with minimal impact, but the funky part is that you can do it directly as part of your application and only shows when you actually look at the page :) it's kind of like quantumanalytics just the other way round!